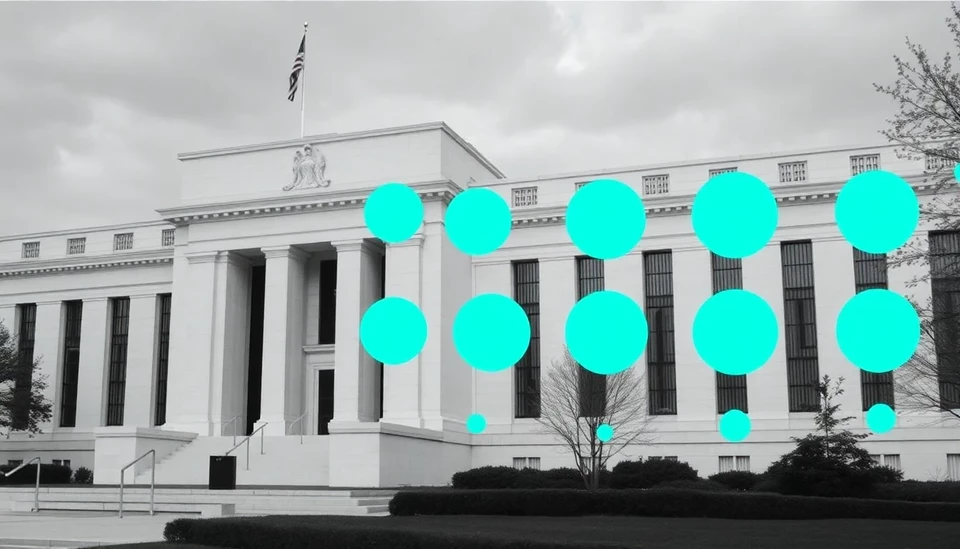
The Federal Reserve (Fed) employs various tools to gauge the economic landscape and inform its monetary policy decisions. One of the most critical of these tools is the Fed’s “dot plot,” a graphical representation that showcases the interest rate projections from each member of the Federal Open Market Committee (FOMC). With recent discussions surrounding interest rates and inflation, understanding the significance and implications of the dot plot has become increasingly vital for investors, policymakers, and the general public.
The dot plot is released quarterly and reflects the individual economic forecasts of FOMC members regarding the appropriate federal funds rate over the next few years. Each dot represents an FOMC member's prediction for where they believe interest rates should be at the end of each of the next few years, offering insight into the collective expectations of the committee. For example, if a majority of dots cluster around a specific rate, it indicates a consensus among committee members about future monetary policy directions.
One critical aspect of the dot plot is its role in signaling the Fed’s future policy moves. The positioning of the dots can influence market behavior by indicating the potential trajectory of interest rates. A shift in the number of dots that suggest higher rates can lead to increased volatility in financial markets, affecting everything from stocks to bonds and currencies. Conversely, a cluster of lower projections may provide a sigh of relief for investors concerned about rising borrowing costs.
The dot plot’s effectiveness as a forecasting tool, however, is often debated. Critics argue that the changing economic landscape can render prior projections obsolete. For instance, factors such as inflationary pressures, employment trends, and geopolitical events can impact the Fed’s outlook, making past dot plots less reliable as economic indicators. Moreover, the dot plot should not be interpreted as a rigid commitment, as the Fed emphasizes that these projections are subject to change based on evolving economic conditions.
Another important dimension of the dot plot is its utility in enhancing transparency. By illustrating a range of perspectives within the FOMC, the dot plot helps markets to understand the diverse viewpoints and concerns of committee members. This transparency can foster better communication between the Fed and the public, alleviating uncertainty about future policy measures.
In recent months, the dot plot has gained heightened attention due to rising inflation and an increasingly complex economic environment. As the Fed navigates the challenges of stabilizing prices without stifling growth, the dot plot may provide vital insights into how officials perceive the balance between these two competing risks. Economists and analysts closely scrutinize any shifts in the placements of the dots, as these changes may convey shifts in the Fed’s stance toward inflation and economic growth.
As we look to the future, it is essential to recognize that while the dot plot offers valuable insights, it ultimately serves as one of many tools in the Fed’s toolbox. Decisions regarding interest rate adjustments will continue to be influenced by a wealth of data, economic indicators, and unforeseen circumstances. Therefore, while the dot plot remains a key focal point for understanding the Fed's monetary policy direction, it should be analyzed in conjunction with other economic data and developments.
In summary, the Federal Reserve’s dot plot is a crucial element in visualizing the committee's interest rate forecasts, providing insights into monetary policy expectations. Its ability to influence market behavior, combined with its emphasis on transparency and consensus among officials, makes it an integral component of navigating economic uncertainty. As policymakers and investors alike remain vigilant about inflation trends and economic growth, the dot plot will undoubtedly continue to play a significant role in shaping monetary policy discussions.
#FederalReserve #DotPlot #InterestRates #MonetaryPolicy #FOMC #Finance #Inflation #EconomicForecasts #MarketTrends #InvestmentStrategies
Author: Laura Mitchell


